Bert and I got talking this morning about Python startup time — Bert has a theory that batching stat calls via io_uring might lead to worthwhile interpreter startup time improvements.
In order to start validating that, we first wanted to see what system calls the python interpreter made. I made a blank python file:
touch /tmp/empty.py
And ran it with strace:
strace python3 /tmp/empty.py 2> /tmp/empty.py.log
This gives us nearly 900 syscalls, which is a lot to manage by hand. After grepping through it and poking at it in vim, I wanted to see a histogram. Luckily, VisiData makes this easy:
cut -f1 -d"(" /tmp/empty.py.log | vd
That loads the data about which syscalls are being called (the cut command removes everything but the name of the syscall, so, for instance, all calls to stat look the same) into VisiData. Once I've done that, I can press Shift+F to get a histogram:
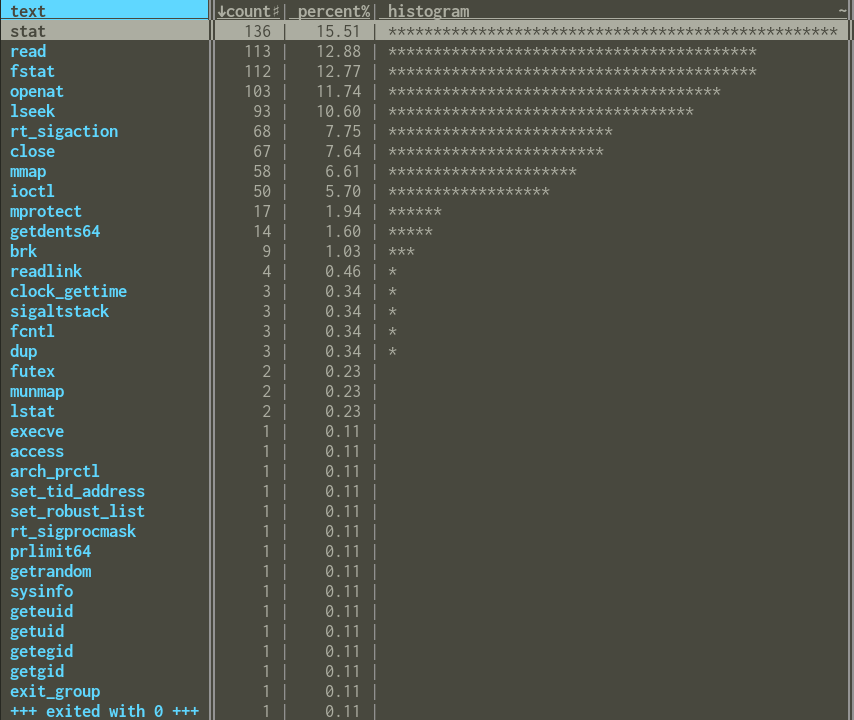
From that we can see that stat and fstat make up around 28% of the syscalls by volume, which makes them a potentially reasonable target for optimization. (After we were done with this, we used perf to get timing information, which seemed to confirm this hypothesis more)
I also did the same process for Ruby, just to see how similar it was:
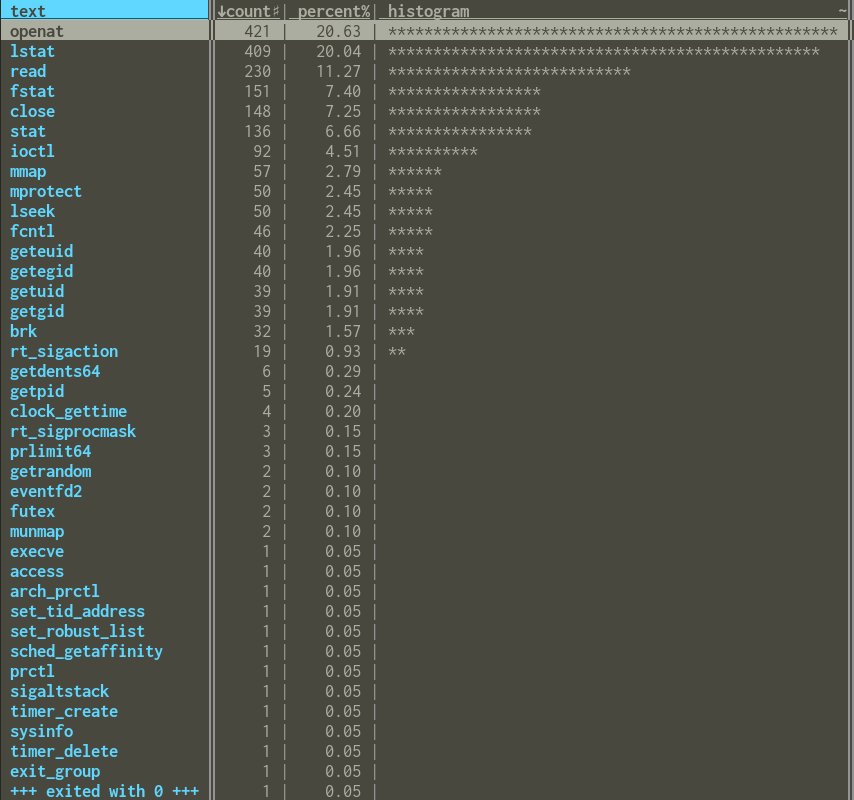
It makes sense that Ruby is around 10x slower to start up in this case than Python, since it's doing many more system calls.
Overall, I've found VisiData to be a super valuable tool for quickly answering questions about datasets. Even if the only tool you know from it is to press Shift+F to get a histogram, that's already extremely useful1 — it took me less than a minute to go from not knowing anything about what syscalls the python interpreter used to seeing a histogram that confirmed some of our speculation.
-
Unix neckbeards will likely point out that
cut -f1 -d"(" /tmp/empty.py.log | sort | uniq -c | sort -hwill work just as well, and they're correct. I use that sometimes as well, but I find that VisiData is usually quicker and allows me to dive into the data in more detail interactively if I want. ↩